|
ATCC
a673 A673, supplied by ATCC, used in various techniques. Bioz Stars score: 94/100, based on 1 PubMed citations. ZERO BIAS - scores, article reviews, protocol conditions and more https://www.bioz.com/product/ewing+tumor+cell+lines+a673/pmc05449623-61-31-32?v=ATCC Average 94 stars, based on 1 article reviews
a673 - by Bioz Stars,
2026-08
94/100 stars
|
Buy from Supplier |
|
CLS Cell Lines Service GmbH
a673 cells A673 Cells, supplied by CLS Cell Lines Service GmbH, used in various techniques. Bioz Stars score: 93/100, based on 1 PubMed citations. ZERO BIAS - scores, article reviews, protocol conditions and more https://www.bioz.com/product/ewing+tumor+cell+lines+a673/custom%40300454%4032585948?v=CLS+Cell+Lines+Service+GmbH Average 93 stars, based on 1 article reviews
a673 cells - by Bioz Stars,
2026-08
93/100 stars
|
Buy from Supplier |
|
Corning Life Sciences
matrigel  Matrigel, supplied by Corning Life Sciences, used in various techniques. Bioz Stars score: 90/100, based on 1 PubMed citations. ZERO BIAS - scores, article reviews, protocol conditions and more https://www.bioz.com/product/ewing+tumor+cell+lines+a673/pmc07925432-114-15-20?v=Corning+Life+Sciences Average 90 stars, based on 1 article reviews
matrigel - by Bioz Stars,
2026-08
90/100 stars
|
Buy from Supplier |
|
ATCC
rt pcr ews cell line a 673 Rt Pcr Ews Cell Line A 673, supplied by ATCC, used in various techniques. Bioz Stars score: 96/100, based on 1 PubMed citations. ZERO BIAS - scores, article reviews, protocol conditions and more https://www.bioz.com/product/ewing+tumor+cell+lines+a673/ppr0276656-70-5-14?v=ATCC Average 96 stars, based on 1 article reviews
rt pcr ews cell line a 673 - by Bioz Stars,
2026-08
96/100 stars
|
Buy from Supplier |
|
ATCC
ewing s sarcoma cells Ewing S Sarcoma Cells, supplied by ATCC, used in various techniques. Bioz Stars score: 94/100, based on 1 PubMed citations. ZERO BIAS - scores, article reviews, protocol conditions and more https://www.bioz.com/product/ewing+tumor+cell+lines+a673/us11944627-1357-80-111?v=ATCC Average 94 stars, based on 1 article reviews
ewing s sarcoma cells - by Bioz Stars,
2026-08
94/100 stars
|
Buy from Supplier |
|
JCRB Cell Bank
human fetal kidney epithelial cell line 293t Human Fetal Kidney Epithelial Cell Line 293t, supplied by JCRB Cell Bank, used in various techniques. Bioz Stars score: 90/100, based on 1 PubMed citations. ZERO BIAS - scores, article reviews, protocol conditions and more https://www.bioz.com/product/ewing+tumor+cell+lines+a673/pmc10826185-226-8-54?v=JCRB+Cell+Bank Average 90 stars, based on 1 article reviews
human fetal kidney epithelial cell line 293t - by Bioz Stars,
2026-08
90/100 stars
|
Buy from Supplier |
|
ATCC
sk lms 1 sarcoma leiomyosarcoma atcc a673 sarcoma Sk Lms 1 Sarcoma Leiomyosarcoma Atcc A673 Sarcoma, supplied by ATCC, used in various techniques. Bioz Stars score: 95/100, based on 1 PubMed citations. ZERO BIAS - scores, article reviews, protocol conditions and more https://www.bioz.com/product/ewing+tumor+cell+lines+a673/us12029724-133-20-24?v=ATCC Average 95 stars, based on 1 article reviews
sk lms 1 sarcoma leiomyosarcoma atcc a673 sarcoma - by Bioz Stars,
2026-08
95/100 stars
|
Buy from Supplier |
|
ATCC
pediatric cancer cell lines Pediatric Cancer Cell Lines, supplied by ATCC, used in various techniques. Bioz Stars score: 95/100, based on 1 PubMed citations. ZERO BIAS - scores, article reviews, protocol conditions and more https://www.bioz.com/product/ewing+tumor+cell+lines+a673/pmc09229839-358-13-26?v=ATCC Average 95 stars, based on 1 article reviews
pediatric cancer cell lines - by Bioz Stars,
2026-08
95/100 stars
|
Buy from Supplier |
|
ATCC
human ewing sarcoma cell lines a673 sk es 1 rd es  Human Ewing Sarcoma Cell Lines A673 Sk Es 1 Rd Es, supplied by ATCC, used in various techniques. Bioz Stars score: 95/100, based on 1 PubMed citations. ZERO BIAS - scores, article reviews, protocol conditions and more https://www.bioz.com/product/ewing+tumor+cell+lines+a673/pm31140328-35-6-23?v=ATCC Average 95 stars, based on 1 article reviews
human ewing sarcoma cell lines a673 sk es 1 rd es - by Bioz Stars,
2026-08
95/100 stars
|
Buy from Supplier |
|
ATCC
a673 extraosseous ewing sarcoma cells A673 Extraosseous Ewing Sarcoma Cells, supplied by ATCC, used in various techniques. Bioz Stars score: 98/100, based on 1 PubMed citations. ZERO BIAS - scores, article reviews, protocol conditions and more https://www.bioz.com/product/ewing+tumor+cell+lines+a673/10__1128_slash_jvi__02106___12-59-5-15?v=ATCC Average 98 stars, based on 1 article reviews
a673 extraosseous ewing sarcoma cells - by Bioz Stars,
2026-08
98/100 stars
|
Buy from Supplier |
|
ATCC
cancer cell lines Cancer Cell Lines, supplied by ATCC, used in various techniques. Bioz Stars score: 99/100, based on 1 PubMed citations. ZERO BIAS - scores, article reviews, protocol conditions and more https://www.bioz.com/product/ewing+tumor+cell+lines+a673/pmc10969893-113-0-22?v=ATCC Average 99 stars, based on 1 article reviews
cancer cell lines - by Bioz Stars,
2026-08
99/100 stars
|
Buy from Supplier |
|
ATCC
a673 human ewing sarcoma cell line 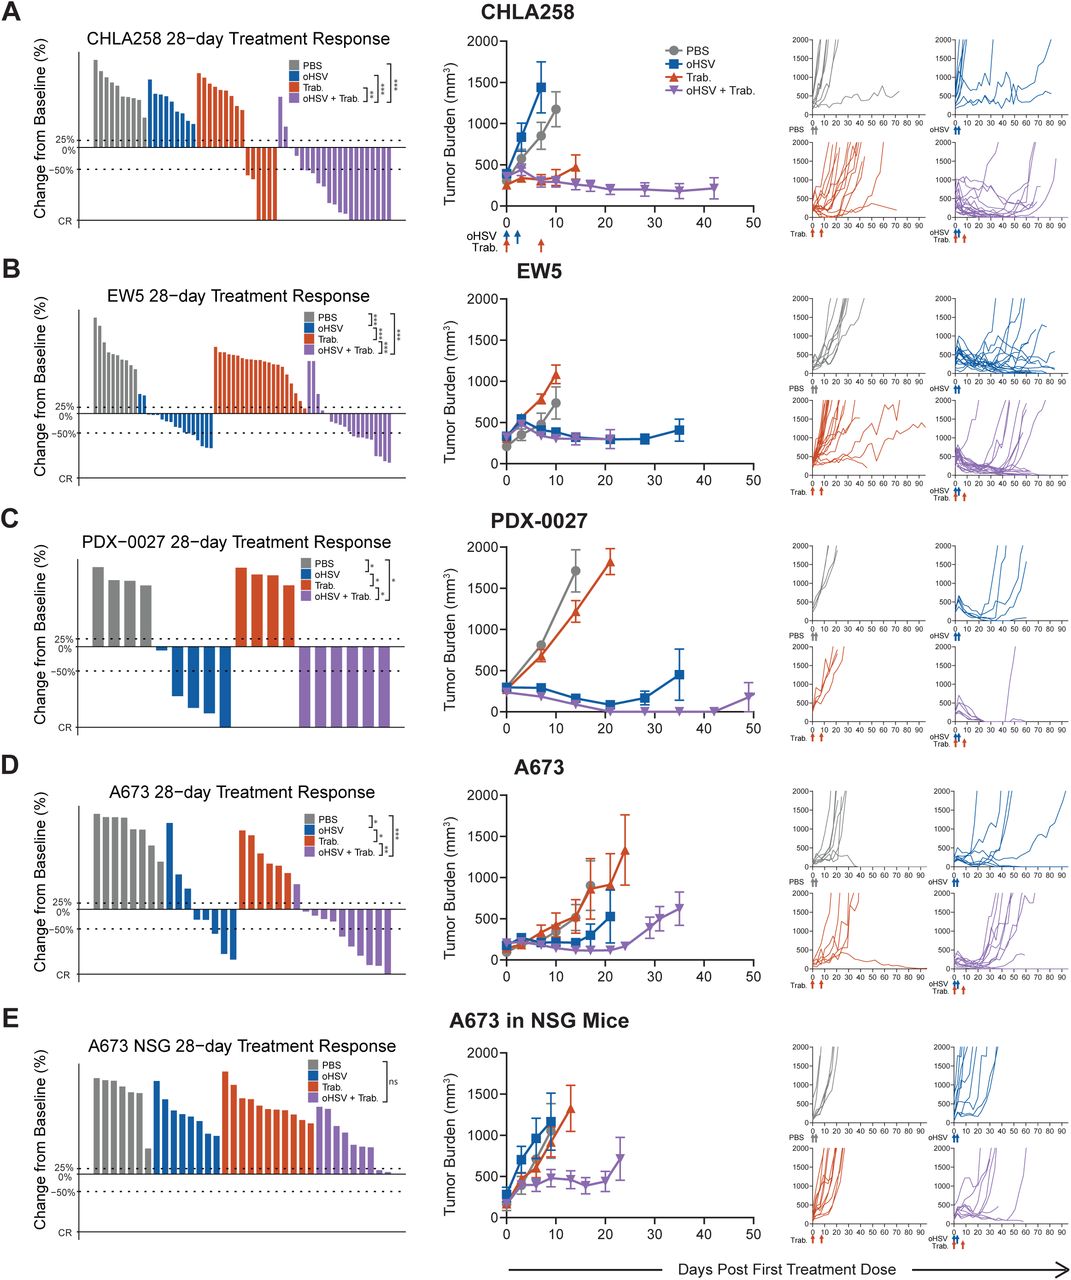 A673 Human Ewing Sarcoma Cell Line, supplied by ATCC, used in various techniques. Bioz Stars score: 99/100, based on 1 PubMed citations. ZERO BIAS - scores, article reviews, protocol conditions and more https://www.bioz.com/product/ewing+tumor+cell+lines+a673/bio_rxiv__2024__03__02__582994-139-1-29?v=ATCC Average 99 stars, based on 1 article reviews
a673 human ewing sarcoma cell line - by Bioz Stars,
2026-08
99/100 stars
|
Buy from Supplier |
Image Search Results
Journal: Cancer immunology research
Article Title: Antitumor effects of CAR T cells redirected to the EDB splice variant of fibronectin
doi: 10.1158/2326-6066.CIR-20-0280
Figure Lengend Snippet: (A) Scheme of retroviral vectors encoding the EDB-CAR, a 2A sequence, and truncated CD19 (tCD19); SH: short hinge; TM: transmembrane domain. (B-C) EDB-CAR expression was determined on T cells 7 days post-transduction by flow cytometric analysis. (B) Representative histogram (Black-filled line: NT T cells; Red-filled line: EDB-CAR transduced T cells) and (C) summary plot (n=7; Student’s t-test; ****p<0.0001). (D) NT and EDB-CAR T cells were incubated for 24 hours with increasing concentrations of rhFN-EDB-coated wells. IFNγ production in supernatants was determined by ELISA (n=4; two-way ANOVA; ***p<0.001; ****p<0.0001). (E) EDB expression of LM7, A673, A549, and U87 tumor cells, and two primary fibroblast cell lines (Fib 1, Fib 2) determined by RT-qPCR; dotted line represents the ΔCt score above which samples are considered positive. (F) NT and EDB-CAR T cells were incubated for 48 hours with EDB-positive tumor cells. IFNγ and IL2 production in supernatants was determined by ELISA (two-way ANOVA; ****p<0.0001). (G) Cytolytic activity of NT or EDB-CAR T cells at a E:T ratio of 4:1 against EDB-positive tumor cells (MTS assay; n=3; two-way ANOVA; *p<0.05; **p<0.01; ***p<0.001). (H) Cytolytic activity of NT or EDB-CAR T cells against primary fibroblasts (data of Fib 1 and Fib 2 was combined) at the indicated E:T ratios, with A549 serving as controls (n=3; two-way ANOVA; ****p<0.0001). (I) NT, EDB-CAR, or mutEDB-CAR T cells were incubated for 48 hours with U87 or U87FN−/− cells. IFNγ production in supernatants was determined by ELISA (n=3; two-way ANOVA; ****p<0.0001). (J) Cytolytic activity of NT, EDB-CAR, or mutEDB-CAR T cells against U87 or U87FN−/− cells (n=3; two-way ANOVA; ****p<0.0001). Mean+SEM is shown in panels.
Article Snippet: Experiments with CD31-positive vascular endothelial cells Mice were injected s.c. with 2×10 6 U87 or
Techniques: Retroviral, Sequencing, Expressing, Transduction, Incubation, Enzyme-linked Immunosorbent Assay, Quantitative RT-PCR, Activity Assay, MTS Assay

Journal: Cancer immunology research
Article Title: Antitumor effects of CAR T cells redirected to the EDB splice variant of fibronectin
doi: 10.1158/2326-6066.CIR-20-0280
Figure Lengend Snippet: (A-H) 2×10⁶ of the indicated tumor cells were injected into NSG mice s.c.. On day (D)7 (U87, A673, U87FN−/−) or D10 (A549) post tumor cell injection, mice received a single i.v. dose of 1×10⁶ NT or EDB-CAR T cells. Tumor growth was monitored weekly by caliper measurement (n=10 mice/group; 5 mice/T-cell donor; log-rank test; *p<0.05; ***p<0.001). (A) Experimental scheme and tumor growth for the U87 model. (B) U87 model: Kaplan-Meier survival curve. (C) Experimental scheme and tumor growth for the A549 model. (D) A549 model: Kaplan-Meier survival curve. (E) Experimental scheme and tumor growth for the A673 model. (F) A673 model: Kaplan-Meier survival curve. (G) Experimental scheme and tumor growth for the U87FN−/− model. (H) U87FN−/− model: Kaplan-Meier survival curve. (I) NSG mice that survived long-term post initial A549 (n=2) or U87 (n=3) s.c. tumor cell injection and EDB-CAR T-cell therapy were re-challenged with a single s.c. dose of cognate tumor cells. Naïve mice served as controls. Tumor growth was monitored weekly by caliper measurement. (J) Macroscopic tumor necrosis of tumors <2,000 mm3 (Student’s t-test; *p<0.05) of the experiments shown in panels A-I; dots represent how many tumors had macroscopic necrosis out of 10 tumors per cell type; dotted line represent baseline (1 tumor with macroscopic necrosis).
Article Snippet: Experiments with CD31-positive vascular endothelial cells Mice were injected s.c. with 2×10 6 U87 or
Techniques: Injection

Journal: Cancer immunology research
Article Title: Antitumor effects of CAR T cells redirected to the EDB splice variant of fibronectin
doi: 10.1158/2326-6066.CIR-20-0280
Figure Lengend Snippet: (A-D) A673 or A549 s.c. tumor-bearing mice received a single dose of NT, EDB-CAR, or EphA2-CAR (A549 only) T cells. Tumors were processed on day (D)10 (A673) or 14 (A549) post T-cell injection and analyzed for CD31 expression (n=4 mice per group with each mouse bearing one tumor; dots represent average of three blind scores per tumor; bars represent average per cohort, two fields-of-view (FOV) per tumor). (B) CD31+ vessels/FOV in the A673 model; Student’s t-test; **p<0.01. (C) CD31+ vessels/FOV in the A549 model; one-way ANOVA; *p<0.05). (D) Representative IHC images for CD31 staining of A549 tumors. Images at 40x magnification; scale bar: 100μm. (E-G) A673 s.c. tumor-bearing NSG mice were imaged using Angiosense 750 on day −1 and day 14 post NT or EDB-CAR T-cell injection. (E) Experimental scheme. (F) Representative images. (G) Quantitation (relative light units (RLU) divided by tumor volume is plotted; n=5 mice/treatment group; Student’s t-test; *p<0.05). (H) Experimental scheme. s.c. tumor-bearing (I) U87 or (J) U87FN−/− NSG mice received a single i.v. dose of NT or EDB-CAR T cells. Tumor were processed on day 10 post T-cell injection and analyzed for CD31 expression (n=4 mouse/tumors per group except for U87FN−/−/NT T-cell group (n=3) with dots representing three blind score per FOV; bars represent average per cohort, 2 FOV per tumor). (K) Representative IHC images for CD31 for U87 and U87FN−/− cells. Images at 40x magnification; scale bar: 100μm.
Article Snippet: Experiments with CD31-positive vascular endothelial cells Mice were injected s.c. with 2×10 6 U87 or
Techniques: Injection, Expressing, Staining, Quantitation Assay
Journal: Artificial cells, nanomedicine, and biotechnology
Article Title: Integrated bioinformatics analysis of miRNA expression in Ewing sarcoma and potential regulatory effects of miR-21 via targeting ALCAM/CD166.
doi: 10.1080/21691401.2019.1620760
Figure Lengend Snippet: Figure 11. (A) Schematic diagram of luciferase reporter assay. The green dots represent stronger fluorescence signal, the blue dots represent weak fluorescence sig- nal. (B) Relative luciferase activity of indicated ALCAM reporter constructs in 293 T cells. Transfection of miR-21 suppressed the activity of the luciferase reporter which contained the 30-UTR of ALCAM significantly but did not influence the luciferase activity of the mutated 30-UTR structure in 293 T cells. p < .01. (C) Microscopic observation of hMSC cell line, A673 cell line and 293 T cells.
Article Snippet: Cell lines and cell culture The
Techniques: Luciferase, Reporter Assay, Fluorescence, Activity Assay, Construct, Transfection
Journal: bioRxiv
Article Title: Trabectedin Enhances Oncolytic Virotherapy by Reducing Barriers to Virus Spread and Cytotoxic Immunity in Preclinical Pediatric Bone Sarcoma
doi: 10.1101/2024.03.02.582994
Figure Lengend Snippet: oHSV+trabectedin synergizes to increase the disease control rate and reduce tumor burden in human xenograft models. The best response for each treated tumor through 28 days, the average tumor burden, and spider plots tracking individual tumor volumes over the full study period are shown for A) CHLA-258 (Ewing sarcoma), B) EW5 (Ewing sarcoma), C) PDX-0027 (rhabdomyosarcoma), D) A673 (Ewing sarcoma), and E) A673 in NSG-SGM3 NK-deficient mice (lack T, B, and NK cells). PBS and oHSV (1.0 x 10⁷ pfu) were given i.Tu. on Days 0 & 2. Trabectedin (0.15 mg/kg) was given I.V. on Days 0 & 7. Statistical analyses of the disease control rates (CR+PR+SD) were performed using a pairwise Fisher’s exact test with p values adjusted using the Benjamini-Hochberg procedure; *p < 0.05, **p < 0.01, ***p < 0.001. Summarized data with error bars depict mean ± SEM.
Article Snippet: The
Techniques: Control

Journal: bioRxiv
Article Title: Trabectedin Enhances Oncolytic Virotherapy by Reducing Barriers to Virus Spread and Cytotoxic Immunity in Preclinical Pediatric Bone Sarcoma
doi: 10.1101/2024.03.02.582994
Figure Lengend Snippet: Trabectedin increases viral spread and decreases antiviral gene expression in immunodeficient Ewing sarcoma models. A) Treatment schema for scRNAseq tumor collection: PBS and oHSV (1.0 x 10 pfu) were given i.Tu. on Days 0 & 2, trabectedin (0.15 mg/kg) was given I.V. on Day 0, and scRNAseq samples were collected on Day 3 to ensure sufficient cell viability for sequencing. B) oHSV viral titer (pfu) from A673 tumors treated with a single dose of oHSV or oHSV+trabectedin. C) UMAP plots of oHSV transcript presence in all tumor cells, split by treatment group. D) Violin plot of the expression level (log-transformed) of all oHSV transcripts for all tumor cells in each treatment group. E) Expression level of HSV time-dependent gene modules shown as a feature plot (UMAP) for all tumor cells and split by treatment groups that contained oHSV. A relative expression cutoff of 1 minimized color skewing by high expressing outlier cells and maintained color scale consistency between feature plots. F) Violin plot of the expression level (log-transformed) of HSV time-dependent gene modules for all tumor cells in treatment groups that contained oHSV. G) Results from gene set enrichment analysis showing the running enrichment score for the “Herpes simplex virus 1 infection” pathway, which represents the intrinsic cellular response to HSV-1. Gene set enrichment analysis was performed on a gene list which was ranked by the gene expression fold change (log2FC) calculated for tumor cells treated with oHSV+trabectedin compared to those treated with oHSV monotherapy. The schema displays the top genes with enrichment changes from the “Herpes simplex virus 1 infection” pathway.
Article Snippet: The
Techniques: Gene Expression, Sequencing, Expressing, Transformation Assay, Virus, Infection